Example project · Infographic video
A survey report as a 90-second infographic video
Jump to a part of the film
We gave Vividemo one chapter of an OECD survey report as a PDF, with a written request. The film it made puts nine of the report's statistics on screen, with narration and captions, and all nine match the report.
- Film length
- 1:30
- Statistics on screen
- 9
- Time to the first cut
- 46 minutes
- Credits for the first cut
- 140
On this page
What's in the 90 seconds
The film opens on a question, gives the report's numbers in four parts, closes on a takeaway and ends on the source. Choose a part to play the film from there.
- Question and takeaway
- Numbers from the report
- Source card
- 0:00Hook
The title “Generative AI at Work.” next to a grid of 100 dots, 31 of them filled. The narrator asks: “What are small businesses actually doing with generative AI and what changes when they do?”
- 0:06AdoptionDot grid
The big number 30.7% and a “31 in 100” dot grid, with the scope “2024 survey · 5,000+ SMEs · 7 countries” and the seven countries by name.
- 0:16What they createBar chart
Four horizontal bars: text 91.6%, images 34.9%, video 16.9% and audio 14.7%, labeled “Among SMEs using generative AI”, with the footnote “Multiple responses allowed”.
- 0:29Sector examplesIllustrated cards
Three illustrated cards from Table 2.1: accommodation and food, construction, and information and communication. Then a strip: 28.7% of users apply generative AI to the core activities of their company.
- 0:46Reported benefitsColumn chart
Three columns: employee performance 65.1%, save money 45.2% and higher revenue 25.9%, next to the note “Self-reported, not causal”.
- 1:08Takeaway
The closing line: “Already useful. Still uneven.”
- 1:20Source card
The source line, CC BY 4.0, the adaptation notice and the survey scope, held until the film ends at 1:30.
Every number, checked against the report
Nine percentages appear on screen. Each one is in the report, with the same denominator the report uses. Page numbers are the report's printed page numbers.
| On screen | In the report | The report's words | Chart in the film |
|---|---|---|---|
| 30.7% | p. 16Text | “Overall, generative AI is in use (by the respondent or a colleague) in 30.7% of SMEs, on average across the countries surveyed.” | 100-dot grid, 31 filled |
| 91.6%, 34.9%, 16.9%, 14.7% | p. 21Text | “Among SMEs using generative AI, 91.6% use it to generate text, compared to 34.9% to generate images, 16.9% to generate video, and 14.7% to generate audio.” | Four horizontal bars |
| 28.7% | p. 21Text. Figure 2.4 rounds it to 29. | “Among SMEs using generative AI, 28.7% report using generative AI in the core activities of their company” | Number strip |
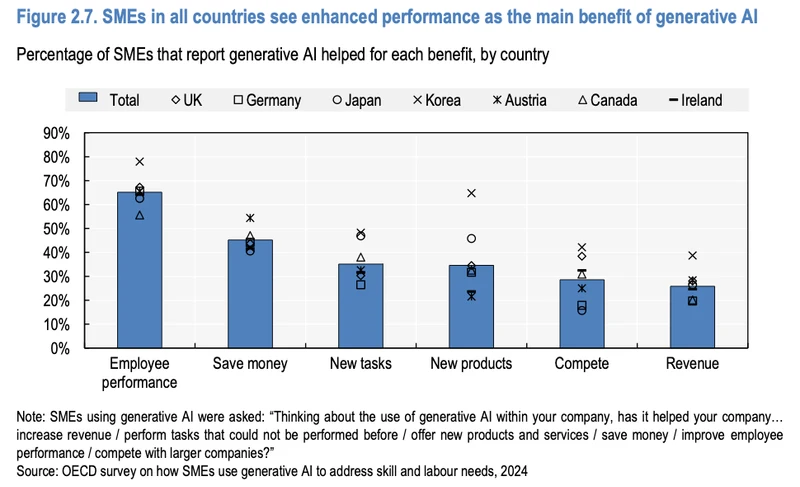
| 65.1%, 45.2%, 25.9% | p. 24Text and Figure 2.7 | “65.1% of SMEs using generative AI report that it helped increase employee performance within the company” “Helping the company save money is the second most reported impact (45.2%)” “increasing company revenue (25.9%)” | Three columns |
| Three sector examples | pp. 23–24Table 2.1 | “Prepare menus by creating or editing images, writing or translating text.” “Produce video simulations of architectural models.” “Develop, debug or simplify code.” | Three illustrated cards |
How we checked
- We pulled frames from the delivered film and read every number on screen, then compared each with the text of the PDF. All nine percentages match the report.
- We measured the bars: 980, 373, 181 and 156 px on a 1,070 px track. That is 91.6, 34.9, 16.9 and 14.6 percent of the track, in proportion to the labels.
- The three benefit columns are 247, 172 and 98 px tall, a ratio of 1 : 0.70 : 0.40, matching 65.1 : 45.2 : 25.9.
- We counted the dot grid: 100 dots, 31 filled.
The film's charts are drawn from the report's numbers in one visual style. Two of them, adoption and content types, turn figures the report gives in a sentence into a chart.
The report next to the film
Adoption: 30.7%
In the report · p. 16 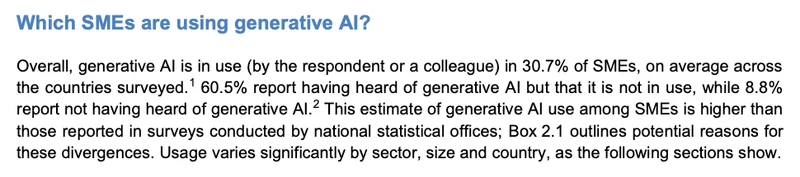
In the film · 0:06–0:16 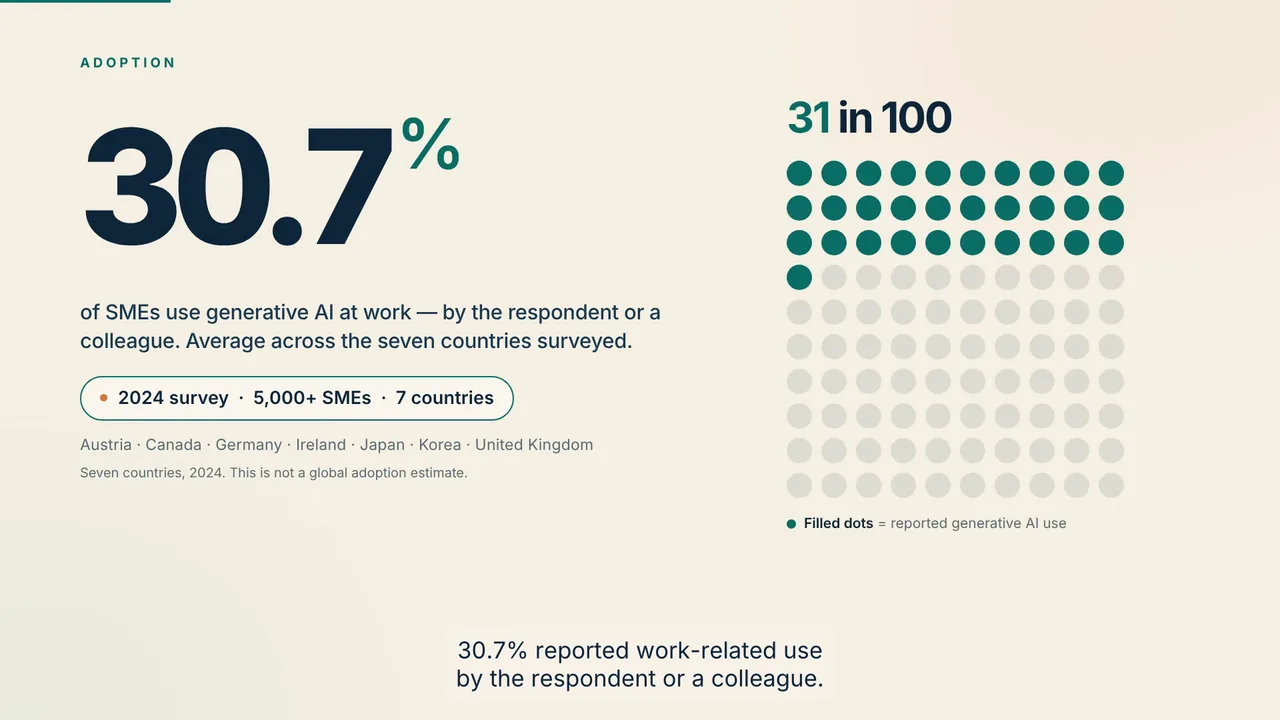
The report gives this number in a sentence. The film turns it into a chart: 100 dots with 31 filled, next to the survey's scope.
What they create: 91.6%, 34.9%, 16.9%, 14.7%
In the report · p. 21 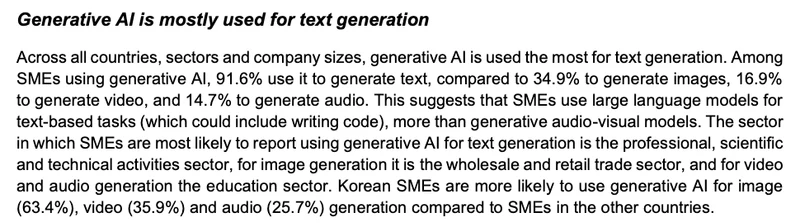
In the film · 0:16–0:29 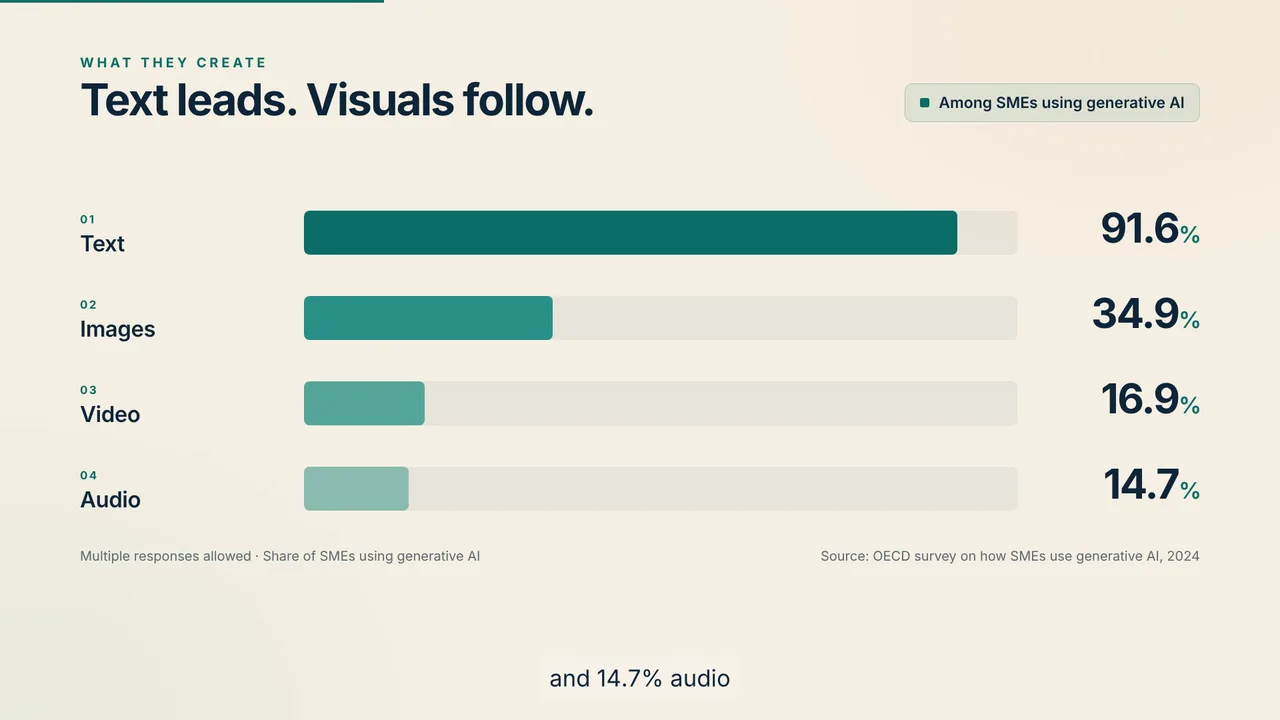
Four shares from one sentence become four bars on one scale, labeled with the report's denominator: SMEs using generative AI.
Core activities: 28.7%
In the report · Figure 2.4 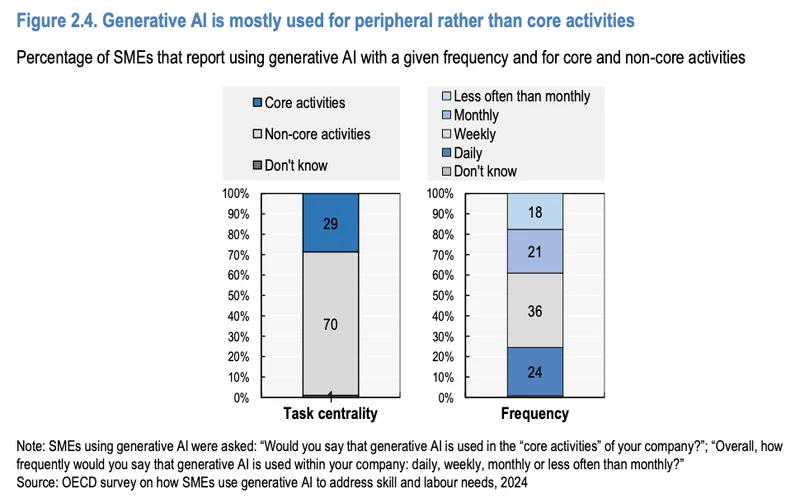
In the film · 0:29–0:46 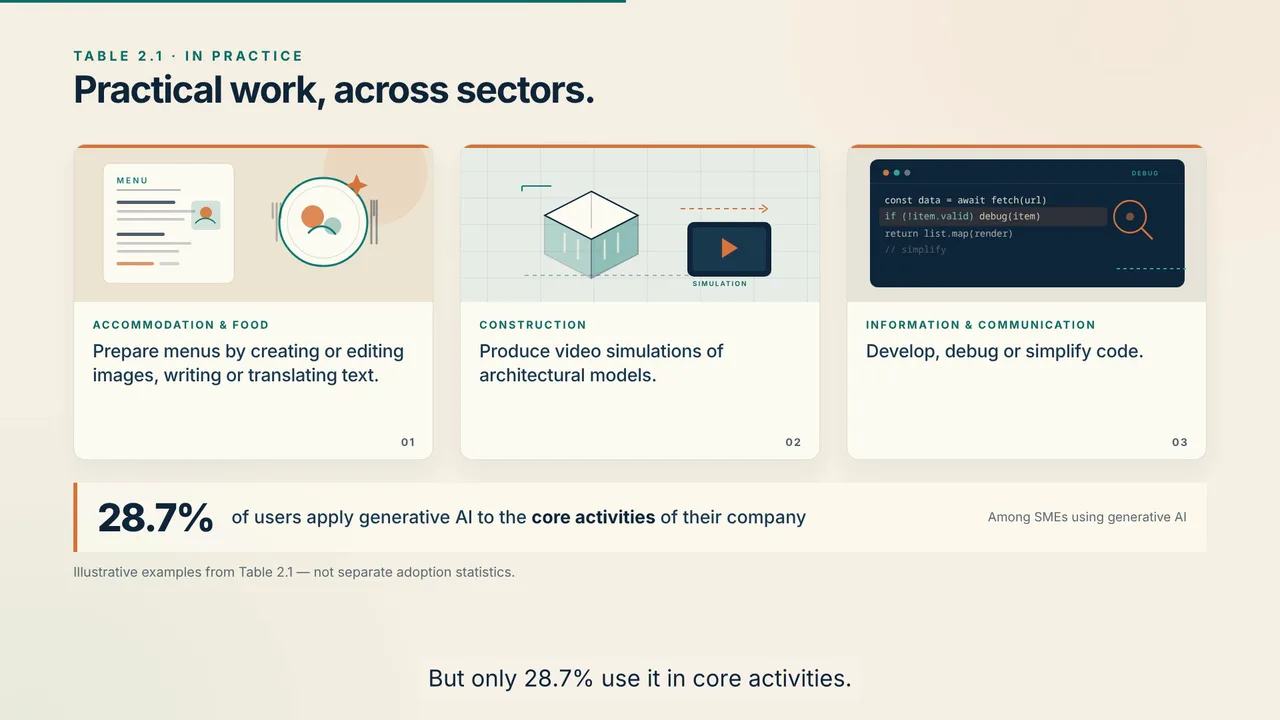
Figure 2.4 rounds this share to 29. The film uses the exact figure from the text on page 21: 28.7%.
Reported benefits: 65.1%, 45.2%, 25.9%
In the report · p. 24 and Figure 2.7 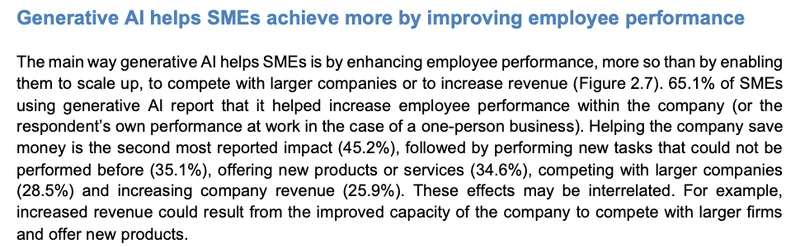
In the film · 0:46–1:08 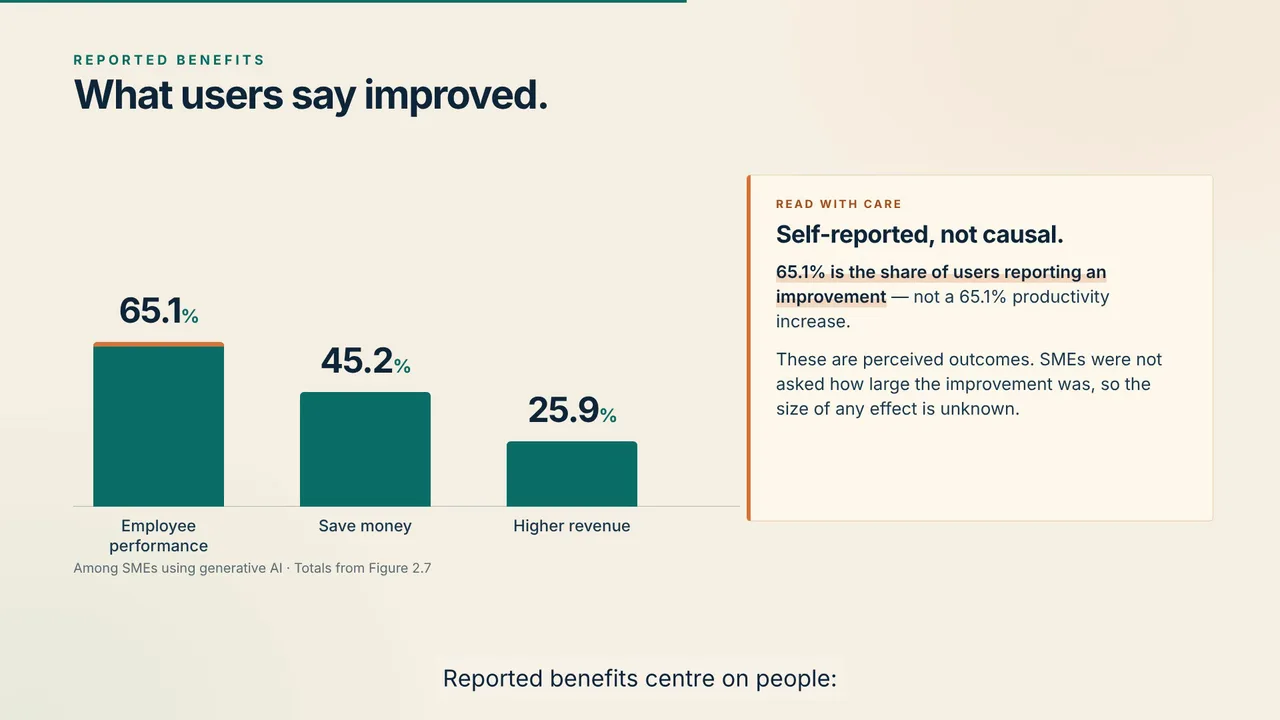
Figure 2.7 charts six benefits. The film shows three of them as columns, with the exact values from the text on page 24 and a note that they are self-reported.
The request
We attached the chapter as a PDF and sent one request of about 600 words. It named the numbers and six beats to show them in, and set out the look, the voice, the captions and the source credit.
Read the full request
Create and deliver a finished 80–90 second English business explainer video from the attached Chapter 2 of OECD (2025), Generative AI and the SME Workforce: New Survey Evidence. Target 88 seconds. English narration, English burned-in subtitles, all on-screen text English. 16:9, 1920×1080, 30fps, MP4 H.264/AAC. Also deliver English SRT and thumbnail. Proceed through production and final render, not just a proposal.

Source: https://doi.org/10.1787/2d08b99d-en . The attachment contains original PDF physical pages 18–30 (printed 16–28), then original copyright/license page 4. Last page is license only. Use Chapter 2 only; no invented numbers or unsupported claims. The survey was in 2024, covered over 5,000 SMEs in seven countries (Austria, Canada, Germany, Ireland, Japan, Korea, UK); report published 2025. Clearly show “2024 survey · 5,000+ SMEs · 7 countries”, never imply this is a global current adoption rate.

Creative direction: title “Generative AI at Work: The SME Reality”. A polished, visually engaging editorial business explainer: warm off-white and deep navy, teal data bars, restrained orange accents, large readable typography, generous space. Animate charts and create original illustrations of real business use cases, not generic robots or stock footage. Visually draw on both the chapter's charts AND Table 2.1. Use motion graphics with purposeful transitions. Natural confident English narrator at conversational pace, soft instrumental background low under voice. Captions maximum two lines, comfortable safe margins, accurate to spoken audio. No rushed reading. Target roughly 175–190 spoken words and preserve a readable end-credit hold within the 80–90 seconds.

Suggested narrative/visual beats (adapt timing to the real narration, without exceeding 90 sec):
1. Hook: What are small businesses actually doing with generative AI?
2. Adoption: 30.7%, approximately 31%, of surveyed SMEs reported work-related use by the respondent or a colleague. Show a clear 31-of-100 visual and survey scope.
3. What they create: among generative-AI-using SMEs, text 91.6%, images 34.9%, video 16.9%, audio 14.7% (Figure 2.4, printed21). Animated bars with exact data labels, narration may round to 92,35,17,15. Label denominator “Among SMEs using generative AI”; multiple responses, so do not use a pie chart.
4. Make Table 2.1 tangible using three original illustrated panels: restaurants creating menus and images; construction firms creating video simulations of architectural models; information/communication firms developing and debugging code. These are illustrative examples, not documentary footage or separate adoption statistics. Could briefly include that only 28.7% of users apply genAI to core activities; otherwise omit if crowded.
5. Reported benefits: 65.1% of users say employee performance improved, 45.2% report saving money, 25.9% report higher revenue (Figure2.7, printed24). Show clear exact labels. VERY IMPORTANT: 65.1% is the share of firms reporting an improvement, NOT a 65.1% productivity increase. These are self-reported outcomes, not proven causal effects. Say this plainly in the narration.
6. Closing takeaway: many SMEs are already using genAI in practical everyday work, while benefits and adoption remain uneven. This is editorial synthesis, avoid unsupported predictions or recommendations.

Rights and credits: source is CC BY 4.0, NOT public domain. Redraw charts in our own style. Do not reuse the cover photo, OECD logo, or third-party images. Use only original illustrations/graphics and appropriately licensed/generated audio. Include a readable source credit and CC BY 4.0 on the end card, plus the full required adaptation notice, which need not be narrated: “This is an adaptation of an original work by the OECD. The opinions expressed and arguments employed in this adaptation should not be reported as representing the official views of the OECD or of its Member countries.” Source line: “Source: OECD (2025), Generative AI and the SME Workforce, Chapter 2. doi.org/10.1787/2d08b99d-en · CC BY 4.0.” Keep this legible on 1080p. Also repeat attribution in a delivered text file.

Please render and actually inspect the completed video: 80–90s duration, audible English voiceover, synced English subtitles, no clipped chart labels or overlapping titles/captions, correct percentages/denominators, readable credit. Use the existing account credits and motion-graphics workflow; no purchases or top-ups. Deliver the playable final video, SRT, and thumbnail here.
What the agent did
- Read the PDF. Its first reply:
“I'll start by inspecting the attached PDF and confirming the source data.”
- Checked the brief against it. The request credited the content-type numbers to Figure 2.4. The delivery came with this note:
“One source note: the attached excerpt’s Figure 2.4 is the core-activity chart, so the content-type chart is credited to Chapter 2 and the 2024 OECD survey rather than that figure number.”
- Wrote the script. Narration for each beat, ending on the takeaway:
“The picture is uneven but concrete: many small businesses already use generative AI in everyday work, while adoption and reported benefits vary widely. That gap is the story.”
- Generated the narration and music. An English voiceover, with music underneath.
- Drew the charts and illustrations. In its words:
“all charts are redrawn and the three Table 2.1 examples are original vector illustrations”
- Rendered the film. Captions burned into the picture, plus a separate SRT file.
- Inspected the result. Then it delivered:
“Done — the finished 88-second explainer is rendered, inspected, and ready.”
What came back
The first cut arrived 46 minutes after the request and used 140 credits. It ran 88 seconds and came with an SRT caption file, a thumbnail and an attribution text file.
Download the captions of the final cut (SRT)Two rounds of changes
Two more rounds followed the first cut. One added live-action footage; the other was a list of notes.
Round 2: live-action footage
We asked for real workplace footage alongside the charts. Three sentences from the request:
Please revise the completed 88-second video into a more engaging business-report film by adding REAL LIVE-ACTION B-ROLL.
Aim for around 25–30 seconds of live-action footage in the existing timeline, with actual motion rather than still photos with pans.
These are illustrative scenes, not OECD survey participants: include a discreet readable “Illustrative footage” label during the live-action passages.
63 minutes later a live-action cut came back. It has about 29 seconds of licensed stock footage across 7 clips, chosen and edited by the agent, and each passage carries an “Illustrative footage” label. The scenes, in the agent's words: “an employee working at a computer under the opening title, a food-business owner reviewing a tablet followed by a menu-and-food-imagery close-up on a laptop, an architect reviewing drawings and a model, a developer working with code on screen, and a team collaborating behind the takeaway.”
Round 3: 16 notes in one message
We sent 16 timestamped notes in one message. 43 minutes later both cuts came back revised. Three of the changes, before and after:
Header
Before 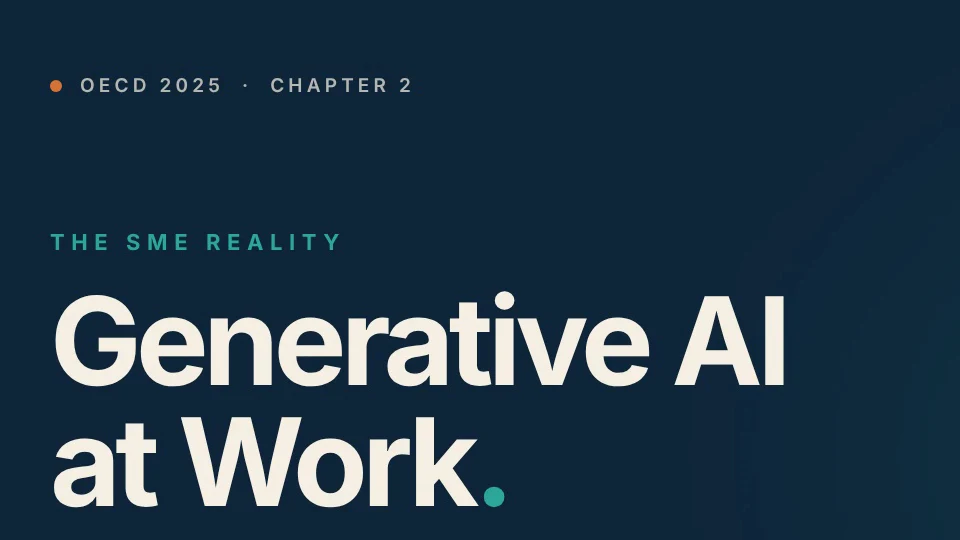
After 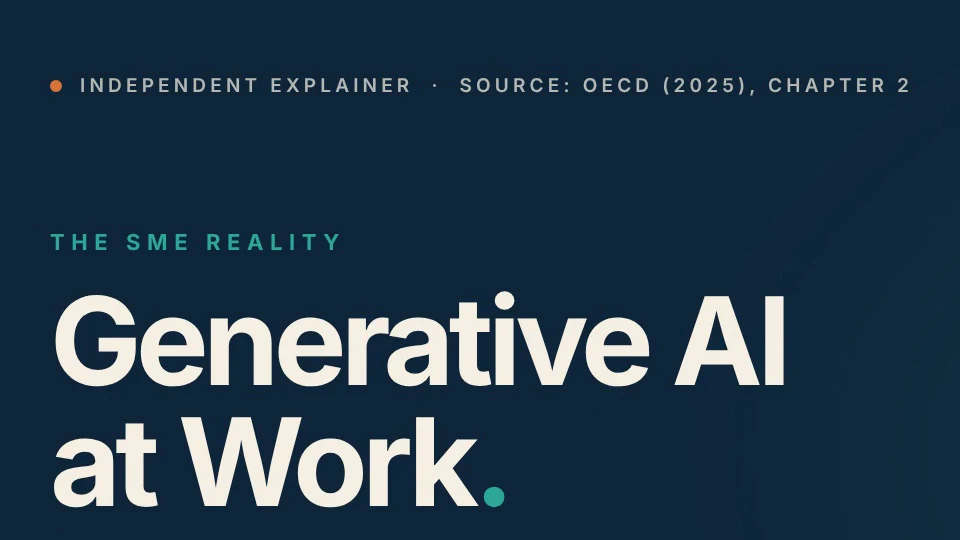
A note gave the exact wording. The header now reads “Independent explainer · Source: OECD (2025), Chapter 2”.
Sector label in the live-action cut
Before 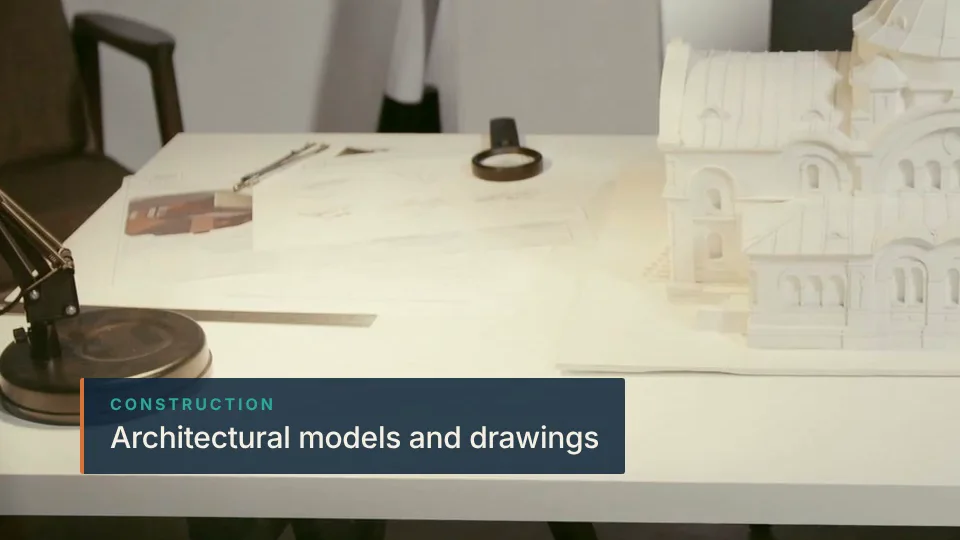
After 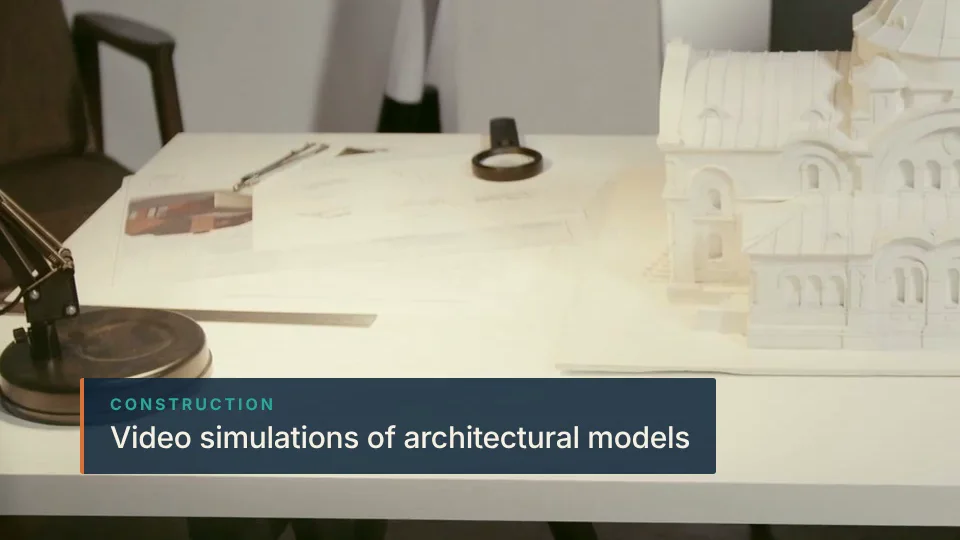
A note asked for Table 2.1's own wording. The label now reads “Video simulations of architectural models”, as the table does.
End card
Before 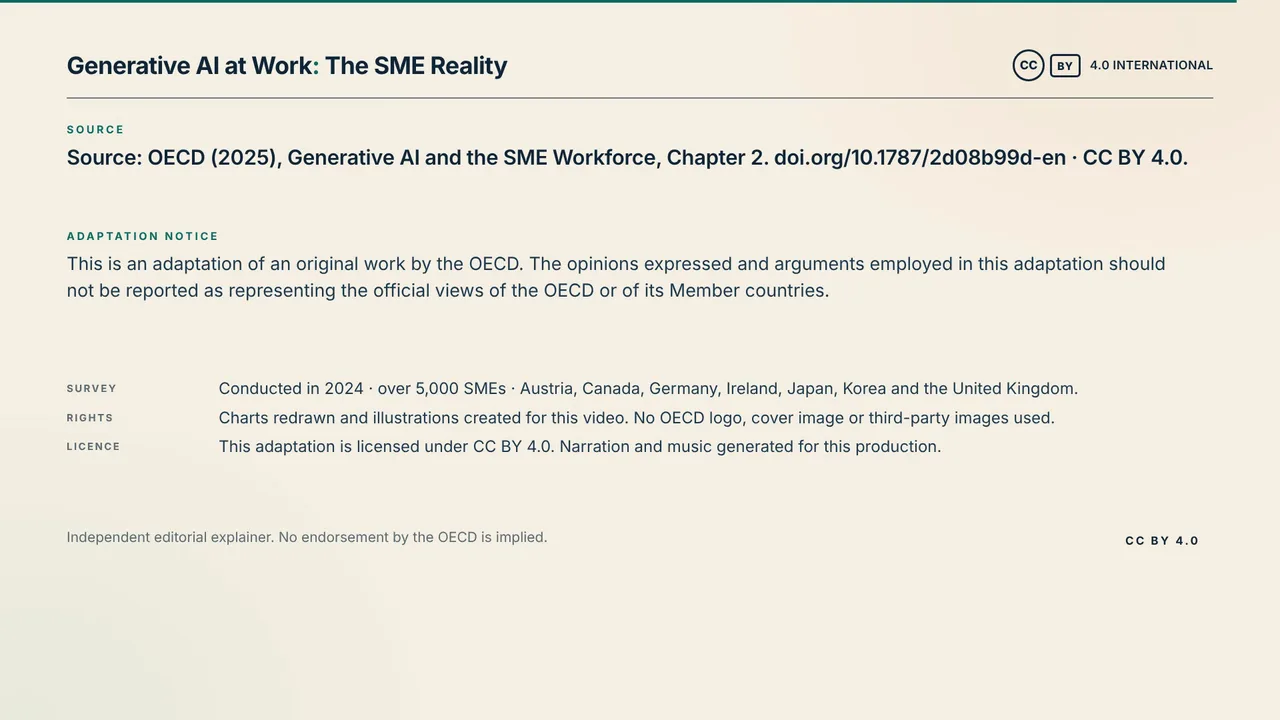
After 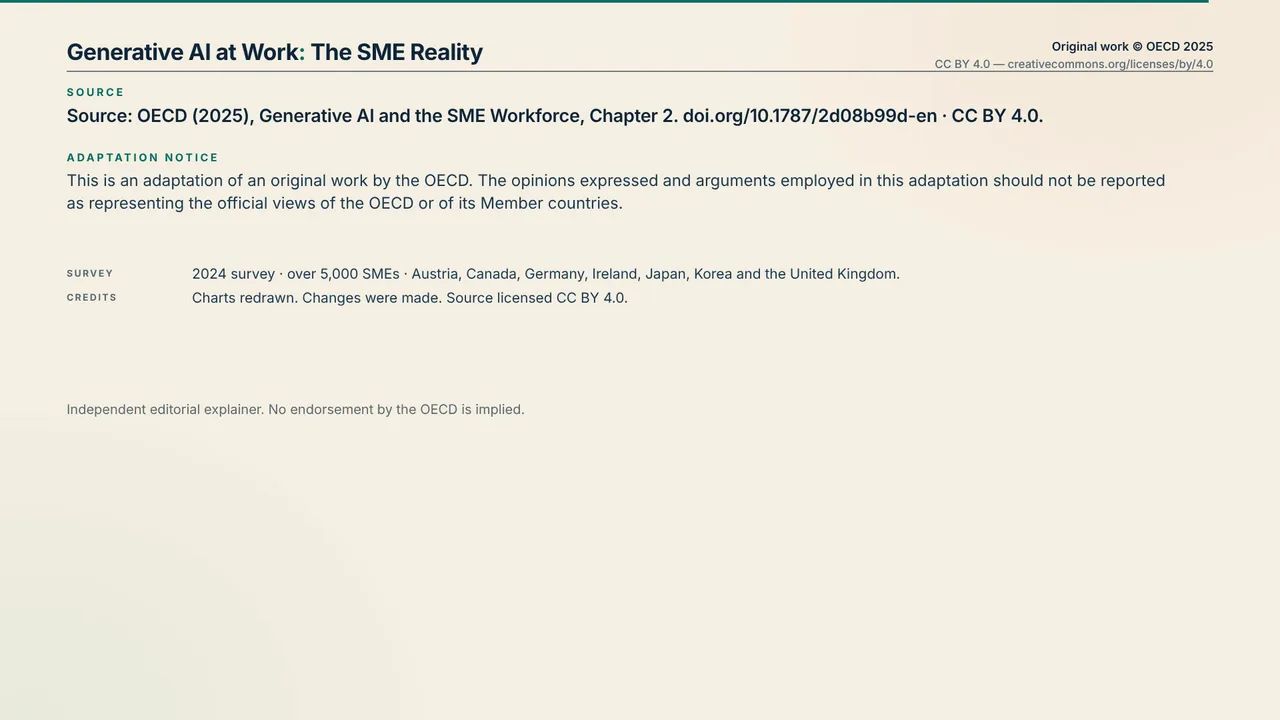
A note asked for a shorter card that stays up longer. The card is trimmed and now holds for 9.7 seconds, up from about 6.
In the revised cuts, percentages also appear at their final value instead of counting up, scene changes are clean cuts, and the chart footnote stays up for the whole scene.
What it cost
The three rounds took about 2.5 hours and used 370 credits in all, about $3.70.
| Round | What we sent | What came back | Time | Credits |
|---|---|---|---|---|
| Round 1 | The request, about 600 words, with the PDF attached | The infographic cut, 88 seconds, with an SRT caption file, a thumbnail and an attribution text file | 46 min | 140≈ $1.40 |
| Round 2 | A request to add real live-action footage | A live-action cut, 88 seconds, with about 29 seconds of licensed stock footage across 7 clips | 63 min | 97≈ $0.97 |
| Round 3 | 16 timestamped notes in one message | Both cuts, revised, 90 seconds each | 43 min | 133≈ $1.33 |
| Total | About 2.5 hours | 370≈ $3.70 | ||
Round 1's 140 credits went on music (68); the agent's reading, planning and editing (46); and narration (26). Rounds 2 and 3 were the agent's work only, with no new narration or music.
Dollar amounts use the base rate of 100 credits per $1; plans work out to about 116–142 credits per $1. See pricing for plans and credit packs.
What studios quote
Two production companies publish these figures for infographic videos, in their own words:
“A 60-second infographic video can cost anywhere from $700 to $5,000. That's the average price if you hire an agency.”
“A 1-minute illustrated video could take 2 to 4 weeks to produce.”
Darvideo https://darvideo.tv/resource/video-infographics/ “Most professionally produced 60-to-90-second infographic-style videos run $2,500 to $8,000”
“Plan for roughly 3 to 6 weeks end to end for a 60-to-90-second video”
Broadcast2World https://www.b2w.tv/blog/best-infographic-videos
For more published prices, and what other videos made with Vividemo cost, see our explainer video cost guide.
Source and license
OECD (2025), Generative AI and the SME Workforce: New Survey Evidence, OECD Publishing, Paris. https://doi.org/10.1787/2d08b99d-en
The film is made from Chapter 2, “How are SMEs using generative AI?”: a 14-page PDF (printed pages 16–28 and the license page), 489 KB. The survey behind it ran in late 2024 and covered over 5,000 SMEs in Austria, Canada, Germany, Ireland, Japan, Korea and the United Kingdom.
The report is licensed under CC BY 4.0. The film's end card and this page carry the required adaptation notice:
This is an adaptation of an original work by the OECD. The opinions expressed and arguments employed in this adaptation should not be reported as representing the official views of the OECD or of its Member countries.
The report excerpts on this page are © OECD 2025, reproduced under CC BY 4.0. No endorsement by the OECD is implied.
Infographic video FAQ
What is an infographic video?
A short video that explains data with animated charts, icons and text, usually with narration or captions. The film on this page is one: nine statistics from a survey report in 90 seconds.
How do you make an infographic video?
Pick the few numbers that carry the story and the order to show them in, then decide the look, the voice and the length. Put that in a brief with the source attached, and check every number on screen against the source before you publish. The request behind this film is a complete example.
Can AI make an infographic video?
Yes. Vividemo made the film on this page from one chapter of a survey report, as a PDF, and a written request. It wrote the narration, generated the voice and music, drew the charts and illustrations, and added captions. The first cut took 46 minutes and 140 credits. Two rounds of changes brought the total to 370 credits, and all nine percentages in the finished film match the report.
Turn your own report into an infographic video
Upload the report as a PDF and say which numbers matter, who the video is for and how long it should run. Vividemo reads the document, writes the script, draws the charts and shows the credits it uses as it works.